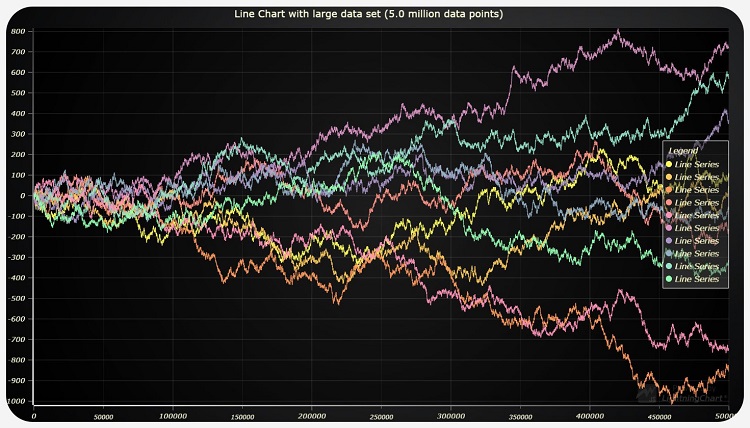
In today’s data-driven world, visual representation plays a key role in improving user engagement and decision-making. For developers building modern interfaces, Vue JS graph libraries offer an efficient way to display complex data interactively. As a leading Top vue js app development company, using the right visualization tools ensures that applications are not just functional but also visually compelling.
Vue’s flexible architecture and lightweight nature make it perfect for integrating graph libraries that turn raw data into actionable insights. Whether you’re building dashboards, analytics platforms, or interactive reports, choosing the right Vue JS graph library can transform your project’s usability and aesthetic appeal.
Table of Contents
Why Data Visualization Matters in Modern Web Applications
Before exploring the best Vue JS graph libraries, it’s essential to understand the importance of visualization in web development. Data visualization simplifies complex information, making patterns, trends, and relationships easy to interpret.
When built with frameworks like Vue.js, these visualizations become more dynamic, responsive, and maintainable. The combination of Vue’s reactivity and advanced graph libraries empowers developers to deliver real-time, data-rich user experiences.
Understanding the Role of Vue JS Graph Libraries
A Vue JS graph library provides prebuilt chart and graph components that can be customized according to design and data requirements. These libraries streamline development by eliminating the need to manually create visual elements from scratch.
Key benefits include:
- Seamless integration with Vue’s component-based structure.
- Enhanced interactivity for data-rich applications.
- Performance optimization for large-scale visualization.
- Support for multiple chart types such as line, bar, pie, and scatter plots.
By leveraging these libraries, developers can focus on application logic while maintaining consistent and high-quality visuals.
Top Vue JS Graph Libraries for Modern Development
1. Vue Chart.js
One of the most popular choices among developers, Vue Chart.js is a simple yet powerful library built around Chart.js. It offers an intuitive API that aligns perfectly with Vue’s reactive principles.
Highlights:
- Supports eight basic chart types.
- Real-time updates with minimal configuration.
- Lightweight and ideal for small to medium-sized projects.
Vue Chart.js is perfect for developers seeking a quick setup and high performance without compromising quality.
2. ECharts for Vue
Developed by Apache, ECharts for Vue is a robust graphing solution known for its versatility and customization. It handles large datasets efficiently, making it a top choice for enterprise-level web applications.
Key Features:
- 20+ chart types including maps, heatmaps, and candlesticks.
- Smooth animations and theming options.
- Excellent support for responsive layouts.
This Vue JS graph library stands out for its scalability and adaptability across industries—from finance to healthcare analytics.
3. D3 + Vue Integration
For developers seeking advanced customization, combining D3.js with Vue.js is a powerful option. D3 (Data-Driven Documents) is a low-level visualization library that provides unmatched flexibility.
Advantages:
- Fine-grained control over SVG elements.
- Dynamic transitions and animations.
- Suitable for data-intensive applications requiring custom interactions.
However, this approach is more suitable for experienced developers who prefer full control over chart behavior and styling.
4. Vue ApexCharts
ApexCharts is widely appreciated for its polished UI and feature-rich chart options. The Vue ApexCharts wrapper enables quick integration with minimal boilerplate code.
Core Benefits:
- Real-time data streaming and zooming.
- Dark and light theme compatibility.
- Excellent documentation and community support.
Vue ApexCharts works exceptionally well for developers who prioritize both functionality and aesthetics in their web dashboards.
5. Vue D3 Network
When working on network or relationship visualizations, Vue D3 Network offers specialized tools for graph-based data structures. It provides interactive node-link diagrams that are perfect for social networks, workflows, or data mapping.
Why It’s Useful:
- Built on D3 for flexibility.
- Offers drag-and-drop interactions.
- Highly customizable nodes and links.
This library adds depth to data representation, enhancing user engagement with complex visual relationships.
How to Choose the Right Vue JS Graph Library
Selecting the right Vue JS graph library depends on several factors such as project scope, data size, and desired visual complexity.
Consider the following:
- Performance requirements – Lightweight libraries like Chart.js work best for smaller projects, while ECharts handles heavy data effortlessly.
- Customization level – D3.js offers the most control, but at the cost of simplicity.
- Ease of integration – Vue-specific wrappers simplify the setup process.
- Community support – Active communities ensure better maintenance and plugin availability.
Align your choice with your business goals and technical expertise to achieve the perfect balance of performance and design.
Best Practices for Implementing Graphs in Vue JS
Even the best libraries can underperform without proper implementation. Here are key practices to ensure optimal results:
- Lazy load chart components to improve page speed.
- Use reactive data binding to update charts dynamically.
- Implement responsive layouts for mobile-first design.
- Minimize redundant computations to boost rendering efficiency.
Following these practices ensures your Vue-based visualization delivers both performance and reliability.
Conclusion
Integrating a Vue JS graph library into your application can drastically enhance its usability, interactivity, and visual appeal. Whether you choose Chart.js for simplicity or ECharts for power, Vue’s ecosystem provides flexible tools to meet your visualization needs.
To maximize project success, partner with a Trusted software product development company in india that specializes in Vue JS app development and understands the nuances of crafting visually stunning, data-driven web experiences.
FAQs
1. What is a Vue JS graph library?
A Vue JS graph library provides prebuilt chart components for displaying data visually within Vue.js applications.
2. Which is the best Vue JS graph library for beginners?
Vue Chart.js is ideal for beginners due to its simplicity and easy setup.
3. Can Vue JS handle real-time data visualization?
Yes. Libraries like ApexCharts and ECharts support real-time updates for dynamic dashboards.
4. Is D3.js compatible with Vue JS?
Absolutely. D3 can be integrated with Vue for advanced, customized visualizations.
5. How do I optimize chart performance in Vue JS?
Use lazy loading, reactive bindings, and efficient data management techniques to ensure smooth performance.